S&D Control Center
Balancing machine learning automation with human intervention for operations teams managing €60 million a year.
Lead Product Designer, 2024
Summary
- Operations wanted manual control. Engineering wanted full automation. The argument had been running for years, and it suddenly became a top priority: a broken script had caused a critical outage and put major client relationships at risk.
- I led the design and proposed an “automate and override” model: the ML model does the volume work, people stay in charge of exceptions. That resolved the tension and got the project moving.
- We shipped a single global platform, replacing 13 country-specific tools. Rate suggestions are visible and easily adjustable, with real-time spend forecasting so teams can publish with confidence.
- The ML model now sets the majority of rates. Operations teams only step in for exceptions.
A broken script, and an argument that had been stuck
Stuart uses incentives to balance courier supply with customer demand. When there aren’t enough couriers in an area, it increases payment rates to attract more. Area Multipliers are the main tool to manage this. They control €60 million a year in payments across Europe.
In 2022, the tooling broke. A script running from someone’s laptop failed. Orders were late & Stuart breached key SLAs, putting major enterprise client relationships at risk.
When we looked into it, the problems went deeper than one broken script. Each country had built their own solutions. People didn’t even understand the mess that had grown organically.
Operations wanted manual control because models couldn’t always handle their complexity. Engineering wanted scalability because manual processes kept breaking. The company overall wanted more automation. That argument had been running for years without resolution, and the broken script had just made it urgent.
As a Lead Product Designer, I was brought in to help work out what to do.
13 tools, and no one understanding the full picture
No one held the full picture. The system had grown organically across countries, and no one person knew what existed, how tools connected, or where they broke.
I worked with the Head of Global Operations to map it. We documented each tool, who used it, what problem it solved, and where it failed.
We found 13 separate solutions doing similar work. Some were proper applications. Others were spreadsheets with scripts. Each had been built to solve a local problem.
Once it was on paper, we could finally have the right conversation. And the same argument kept coming up:
We need to control this manually. Models can’t handle our complexity.
We need to automate everything.
As long as it was framed as a choice between one or the other, the project wasn’t going to move.
Automate and override
I proposed reframing it. Instead of choosing between automation and manual control, we’d design for both at once. I called the principle “automate and override”:
- Use the ALMO model to do the repetitive work: analyse patterns, suggest rates. But make it easy for people to override when they spot something the model missed.
- For people to confidently accept or override, they need to see what the model sees. Visualise the model’s suggestions clearly.
- Put model suggestions and manual edits in the same interface. Don’t make people switch tools.
- Build one system across all countries rather than country-specific tools, with enough flexibility for local needs.
Those four ideas became the decision frame for everything that followed. More importantly, the deadlock was broken. People now had a shared way to talk about the trade-offs.
How this shaped the design
Showing ops what the model was doing
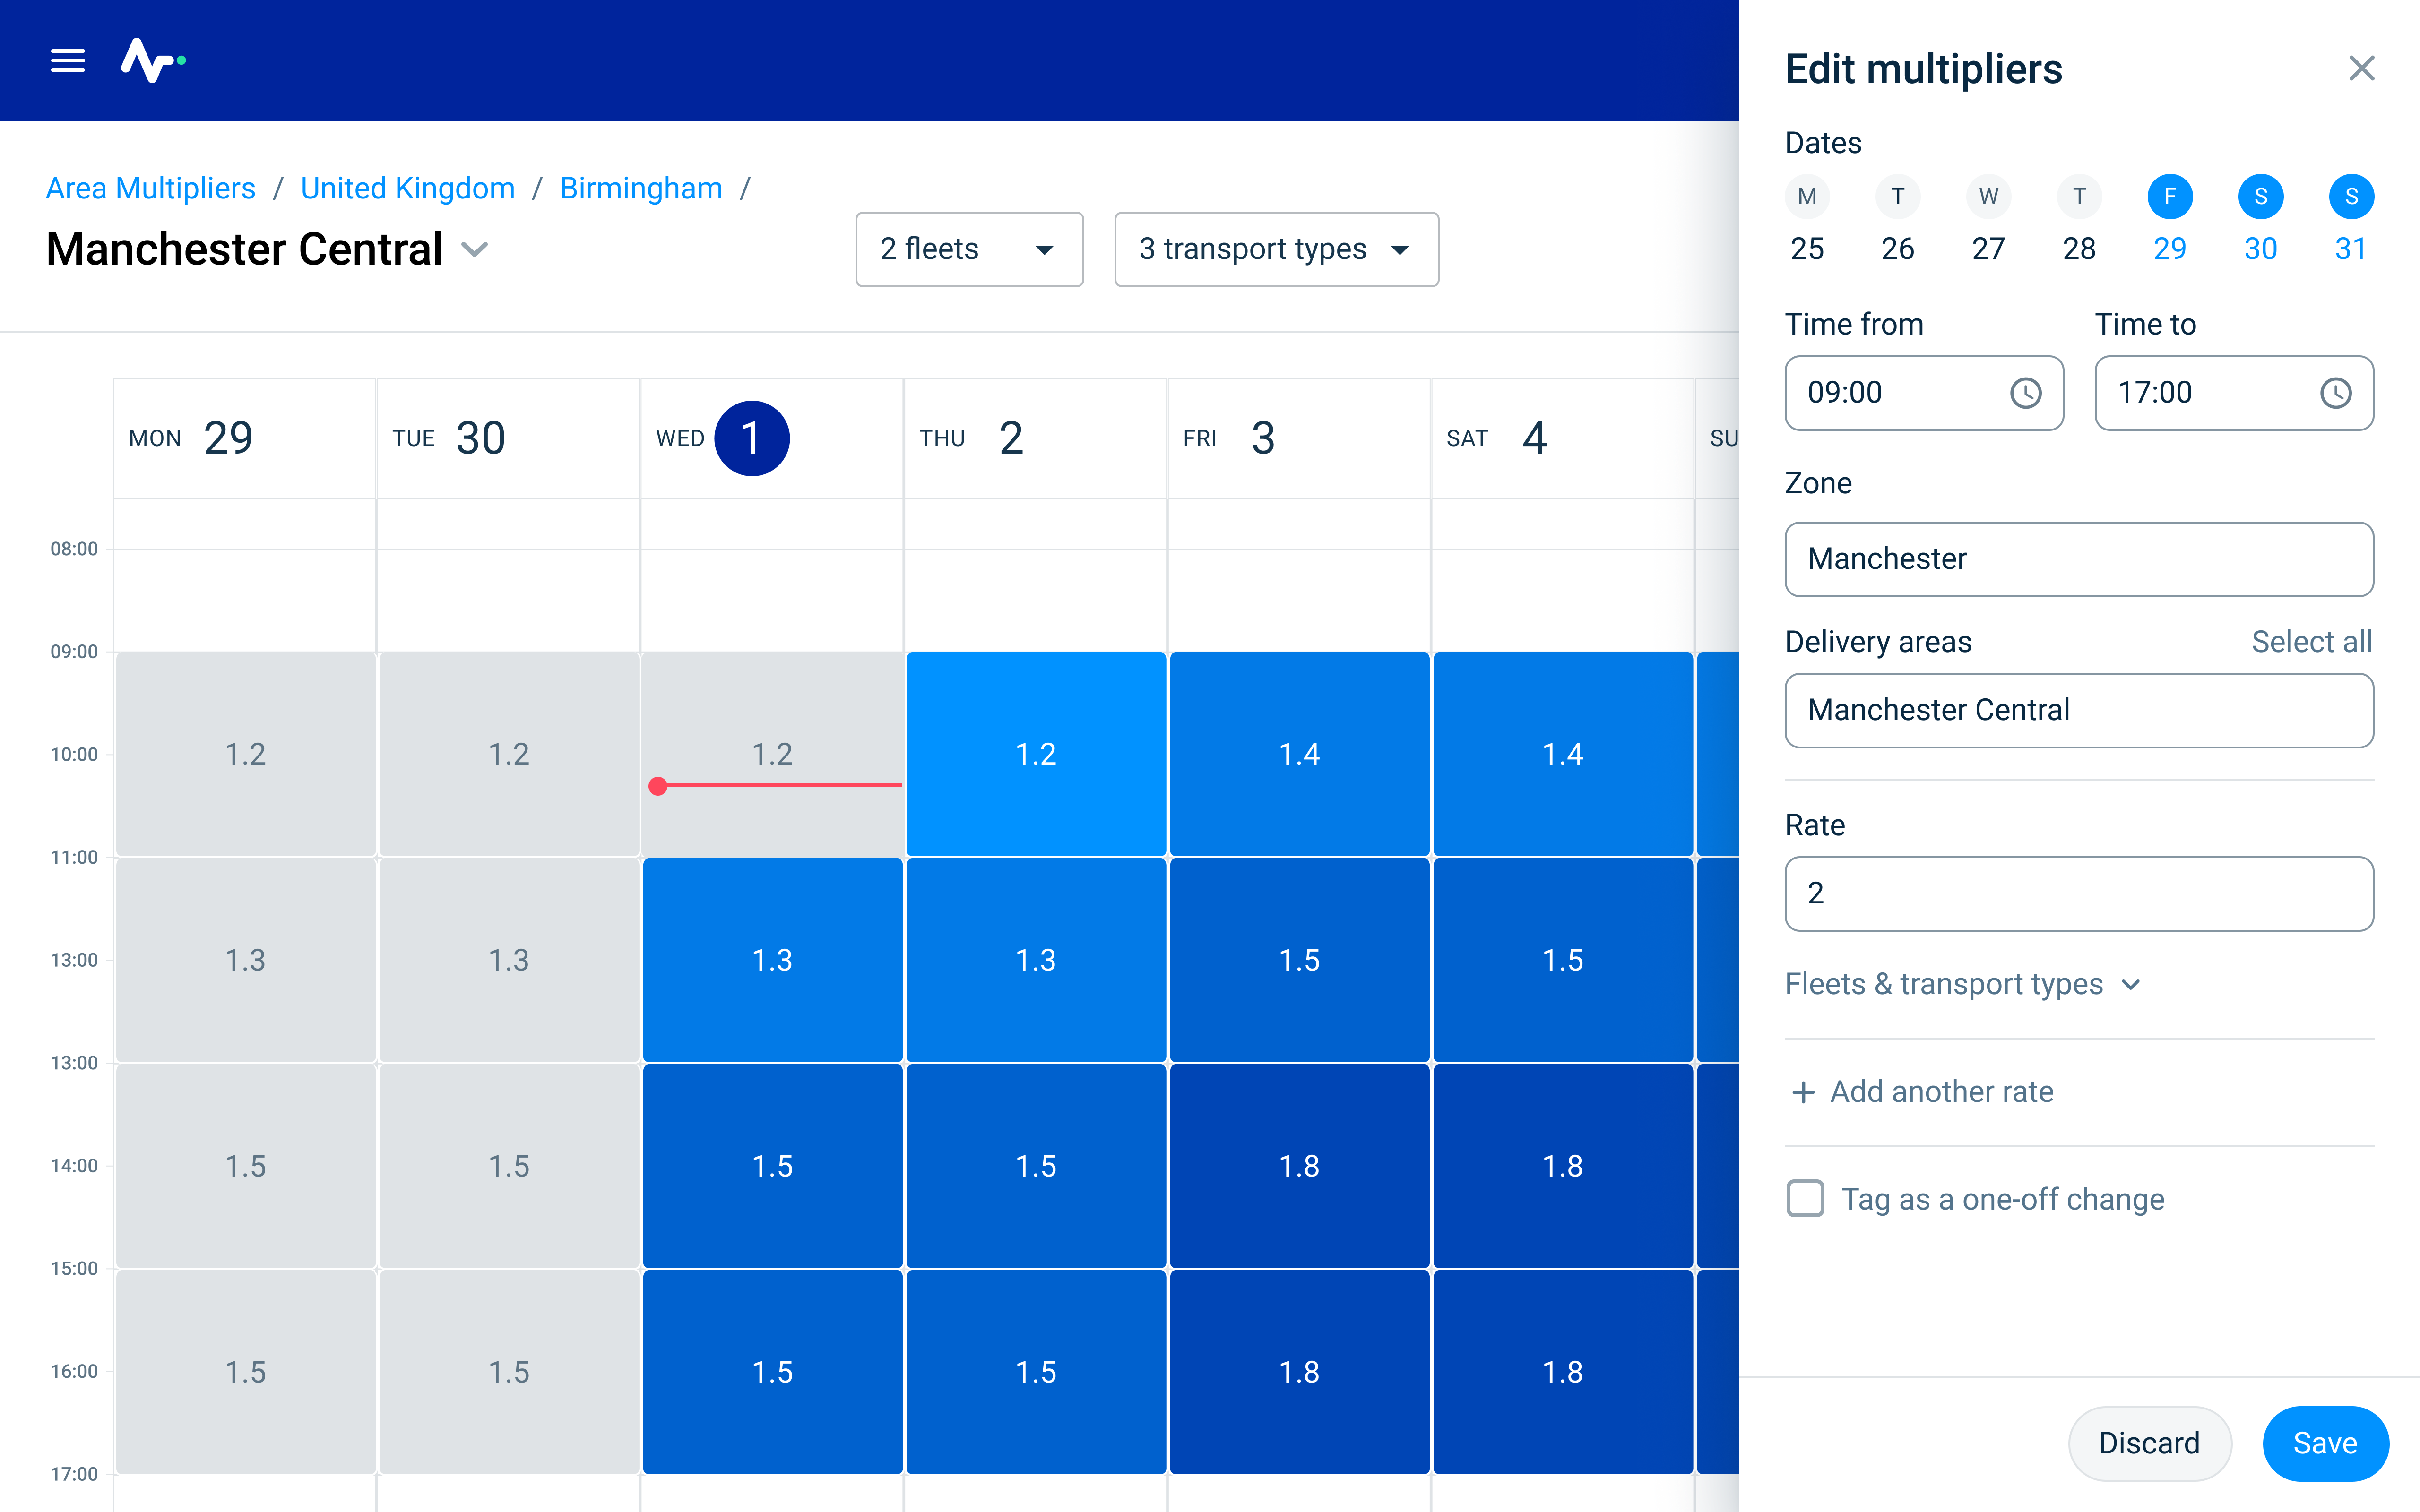
The ALMO model generates weekly rate suggestions using historical demand patterns, weather forecasts, local events, and budget constraints.
I designed the calendar to show these suggestions as a starting point. The suggestions are accepted by default, but operations teams can adjust them or replace them entirely.
The model does the volume work. People handle the exceptions and the things the model can’t see.
Forecasting spend before publishing
Teams kept asking for one thing: show us what changes will cost before we publish them.
Overspend hurts margins. Underspend means late deliveries and breached SLAs. They needed to balance both risks before committing.
I designed real-time spend forecasting. As you edit rates, you see total spend updating, with a comparison to the budget target for that area.
This turned out to be what made the automation adoptable. Without it, trusting the model’s suggestions meant accepting risk with no visibility. With the forecast, ops teams could sanity-check a week of rates in a few minutes and publish with confidence.
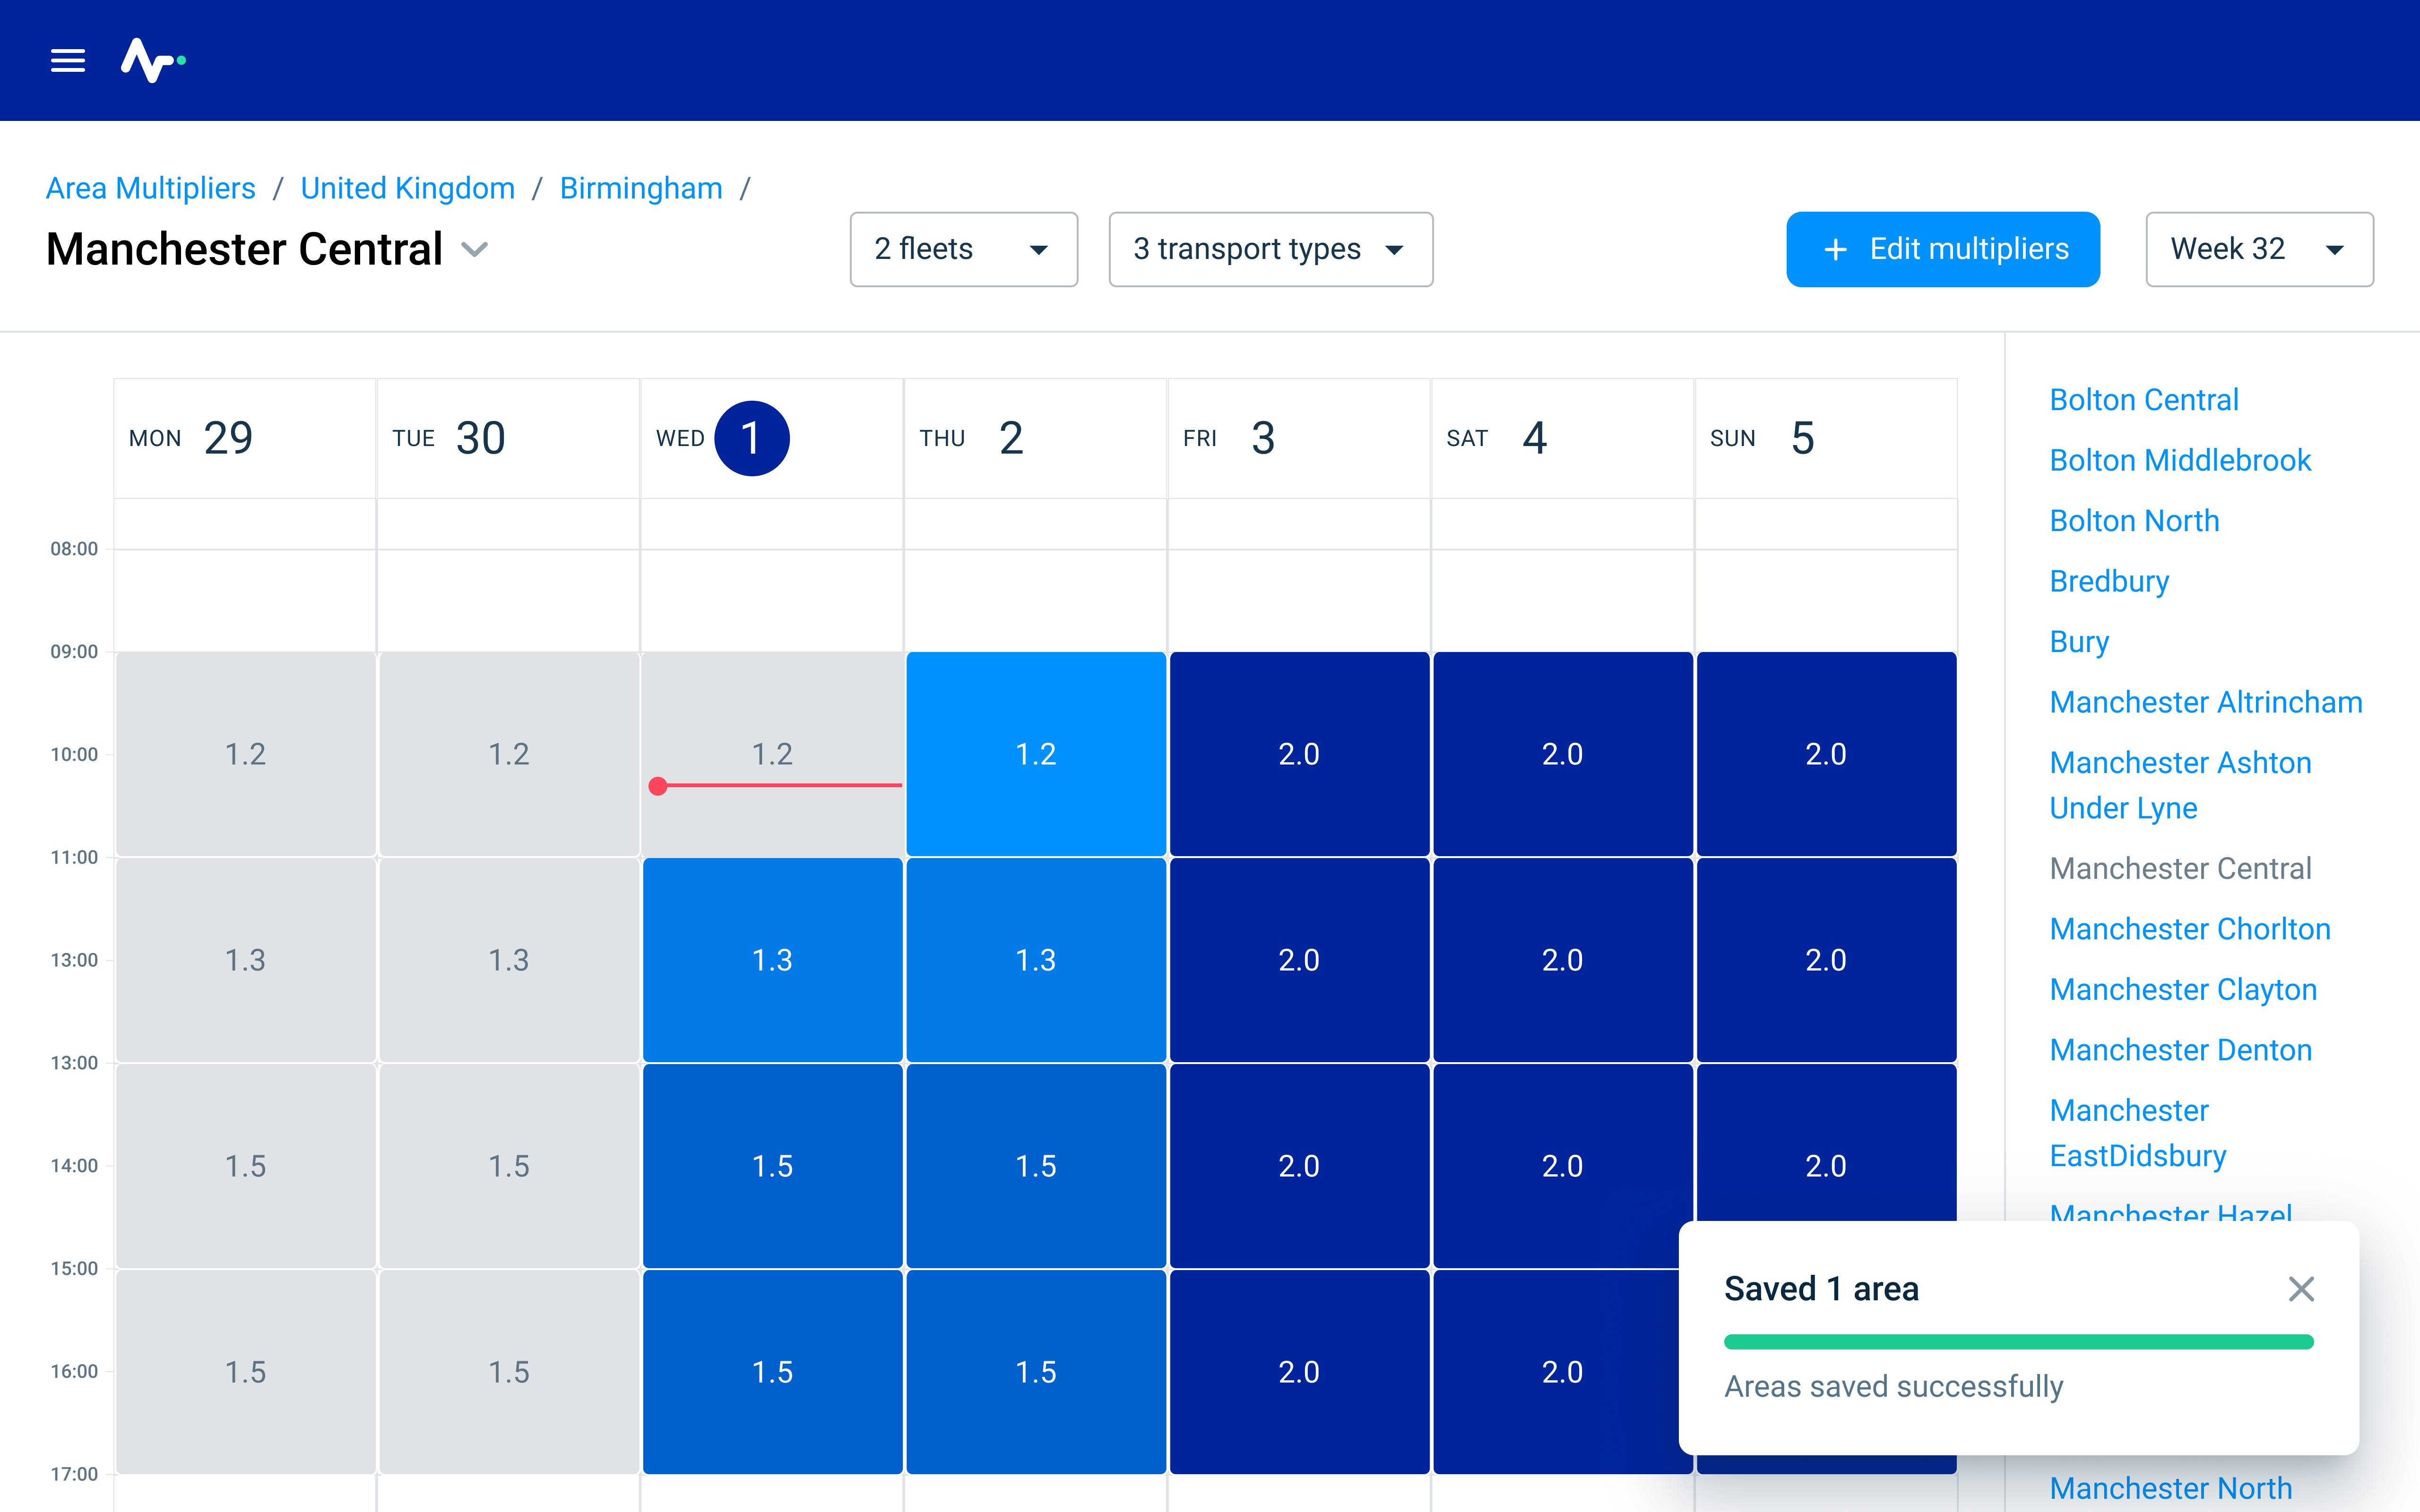
Editing hundreds of areas without losing precision
Operations teams manage hundreds of delivery areas each week. They needed to work in bulk to be efficient, but they also needed to adjust individual areas when something unusual was happening.
The interface supports both:
- a calendar grid where you can see the values and drag to edit multiple slots
- a bulk edit panel
- individual overrides easily available
The technical constraint was that each change triggers API calls. With 100 areas across 7 days and multiple time slots, that’s potentially thousands of calls.
I worked with Engineering to batch requests and design the interface around a bulk-first-then-refine workflow. We showed processing time so people could see what was happening.
Results
- ML model now sets the majority of rates automatically
- Operations teams only intervene for exceptions, not routine work
- From 13 separate solutions to 1 globally adopted platform
- 0 new outages on tooling that manages €60M a year in payments
Why I held back on natural language
Once the platform was working, I explored a natural-language interface. Ops teams would describe changes in plain English:
Boost Central London by 0.3 on Saturday evening.
The AI would generate a staging view to review and refine.
After discussing it with colleagues in product and engineering, I sensed it wasn’t the right moment. In 2024, building this reliably was much harder than it looks today, and the system we’d shipped had already solved the problem. I stopped trying to get it prioritised, and we moved on to other work.